The 2026 Mindful Travel Index
Most travel indices measure how famous a destination is. This one measures something closer to the opposite — how much room a place leaves for the practice of mindful travel: silence, walkability, the ratio of residents to visitors, the median length of stay, and the share of the place that has not yet been flattened by social-media photography. We scored fifty destinations across the five and ranked them. The top of the list is not where the cheap flights go.
Why this index exists
The travel industry is rich in indices that measure the wrong things — most-visited cities, fastest-growing destinations, top-Instagrammed beaches. Each one is a leaderboard of degradation: the places at the top are typically the places mindful travelers should now avoid. We wanted a counter-index. The simplest version of the question we are trying to answer: where, in 2026, is mindful travel still structurally possible?
Trepic is the creator economy meeting travel — AI-powered journaling that turns your itinerary into a story, and your story into a revenue stream. The platform is built around the proposition that long-form storytelling and considered stays are how the next chapter of travel works. This index is the data complement to that thesis: a quantitative read on the destinations that reward exactly that kind of trip.
The five dimensions
Each destination is scored 0–100 across five dimensions. The composite is a simple sum out of 500. We deliberately avoided weighting — the dimensions are co-equal because mindful travel is, in our view, the absence of the failure mode of any one of them. A perfectly silent place that is unwalkable is not a mindful destination. A perfectly walkable medina that is mostly tourists is not either.
1. Silence (0–100)
An inverse-decibel score for ambient sound at the destination's primary visitor sites, measured at typical visitor times of day. High score = low noise. We are measuring not just absolute quiet (Patagonia, Mongolia, Svalbard) but the share of a destination that allows uninterrupted attention — the medina at 6am scores higher than the medina at 11am. Sources: WHO ambient-noise data, our own field notes, public-park acoustic studies where available.
2. Walkability (0–100)
Pedestrian infrastructure and last-mile transit at the destination's main staying area. We grade for sidewalk continuity, traffic separation, average walking distances between major sites, and the existence of car-free zones. Walkability matters because it is the structural enabler of unstructured exploration — the "wandering" mode that mindful travel depends on. Compact European old towns and Japanese castle towns dominate this column; remote wilderness destinations score lower not because they are unwalkable per se, but because they do not have a pedestrian-led "there" to walk through.
3. Locals ratio (0–100)
The ratio of resident population to annual visitor count at the destination's main staying area, normalized to a 0–100 scale. The score is high when residents outnumber visitors at scale (Hokkaido, Patagonia, Andalusia) and low where visitors outnumber residents many-to-one (peak-season Santorini, Tulum, Cinque Terre). This is the single most consequential dimension for what a destination feels like, and it is the one that has degraded fastest in the last decade.
4. Stay length (0–100)
A score scaled to the median visitor length-of-stay at the destination. Places where most visitors stay 1–2 nights score in the 50s. Places where the median stay is 5+ nights score in the 80s and above. Bhutan, Galápagos, and Patagonia score high here because the destinations are structurally remote and visitors stay accordingly; Reykjavik scores lower because it has become a 24-hour stopover for North Atlantic transit.
5. Unphotographed (0–100)
The share of a destination that does not appear in the top-1000 indexed Instagram and TikTok geotags for the area. High score = the place has parts that are still off-camera. We use the top-1000 geotag set as a proxy for the "saturated" surface of a destination; the inverse is the part that mindful travelers can still encounter without their visual experience being pre-mediated. Patagonia, Faroe, Greenland, Bhutan dominate this column. Tulum, peak-season Santorini, and Reykjavik (city only) sit at the bottom.
The 2026 ranking — top 25
The full 50-destination dataset is available as CSV under CC-BY-4.0. The top 25 follow. Top-10 ranks are highlighted in gold and have a one-paragraph rationale below the table.
| Rank | Destination | Country | Sil | Walk | Loc | Stay | Unphot | Total /500 |
|---|---|---|---|---|---|---|---|---|
| 01 | Bhutan (Paro Valley) | Bhutan | 96 | 72 | 98 | 95 | 94 | 455 |
| 02 | Faroe Islands | Denmark | 94 | 78 | 92 | 88 | 96 | 448 |
| 03 | Lofoten Islands | Norway | 92 | 80 | 89 | 86 | 93 | 440 |
| 04 | Setouchi (Naoshima/Teshima) | Japan | 90 | 82 | 90 | 87 | 87 | 436 |
| 05 | Patagonia (Torres del Paine) | Chile | 98 | 60 | 86 | 90 | 92 | 426 |
| 06 | Hokkaido (Furano/Biei) | Japan | 88 | 76 | 90 | 85 | 86 | 425 |
| 07 | Kanazawa | Japan | 84 | 90 | 88 | 82 | 80 | 424 |
| 08 | Madeira (Funchal/Levadas) | Portugal | 82 | 86 | 88 | 84 | 82 | 422 |
| 09 | Big Sur | United States | 90 | 68 | 86 | 82 | 90 | 416 |
| 10 | Galápagos Islands | Ecuador | 86 | 72 | 84 | 86 | 86 | 414 |
| 11 | Istria (Motovun/Grožnjan) | Croatia | 82 | 88 | 86 | 80 | 76 | 412 |
| 12 | Mendoza Wine Country | Argentina | 80 | 78 | 88 | 82 | 82 | 410 |
| 13 | Andalusia (Córdoba/Granada) | Spain | 72 | 92 | 84 | 82 | 76 | 406 |
| 14 | Aeolian Islands | Italy | 84 | 82 | 85 | 80 | 74 | 405 |
| 15 | Azores (São Miguel) | Portugal | 82 | 80 | 86 | 80 | 76 | 404 |
| 16 | Salar de Uyuni | Bolivia | 96 | 55 | 82 | 80 | 89 | 402 |
| 17 | Svalbard | Norway | 94 | 62 | 80 | 82 | 84 | 402 |
| 18 | Yakushima | Japan | 88 | 72 | 82 | 78 | 80 | 400 |
| 19 | Annapurna Circuit | Nepal | 86 | 70 | 86 | 82 | 76 | 400 |
| 20 | Wadi Rum | Jordan | 92 | 55 | 84 | 80 | 88 | 399 |
| 21 | Bagan | Myanmar | 82 | 72 | 86 | 80 | 78 | 398 |
| 22 | Atacama Desert (San Pedro) | Chile | 90 | 66 | 82 | 80 | 80 | 398 |
| 23 | Ladakh (Leh) | India | 88 | 68 | 84 | 82 | 76 | 398 |
| 24 | Greenland (Ilulissat) | Greenland | 94 | 58 | 82 | 82 | 82 | 398 |
| 25 | Hoi An | Vietnam | 72 | 90 | 86 | 80 | 68 | 396 |
| 26 | Amalfi Coast (off-Positano) | Italy | 70 | 84 | 78 | 78 | 62 | 372 |
| 27 | Bali (Ubud) | Indonesia | 68 | 78 | 72 | 80 | 58 | 356 |
Top 10 — why each one ranks where it does
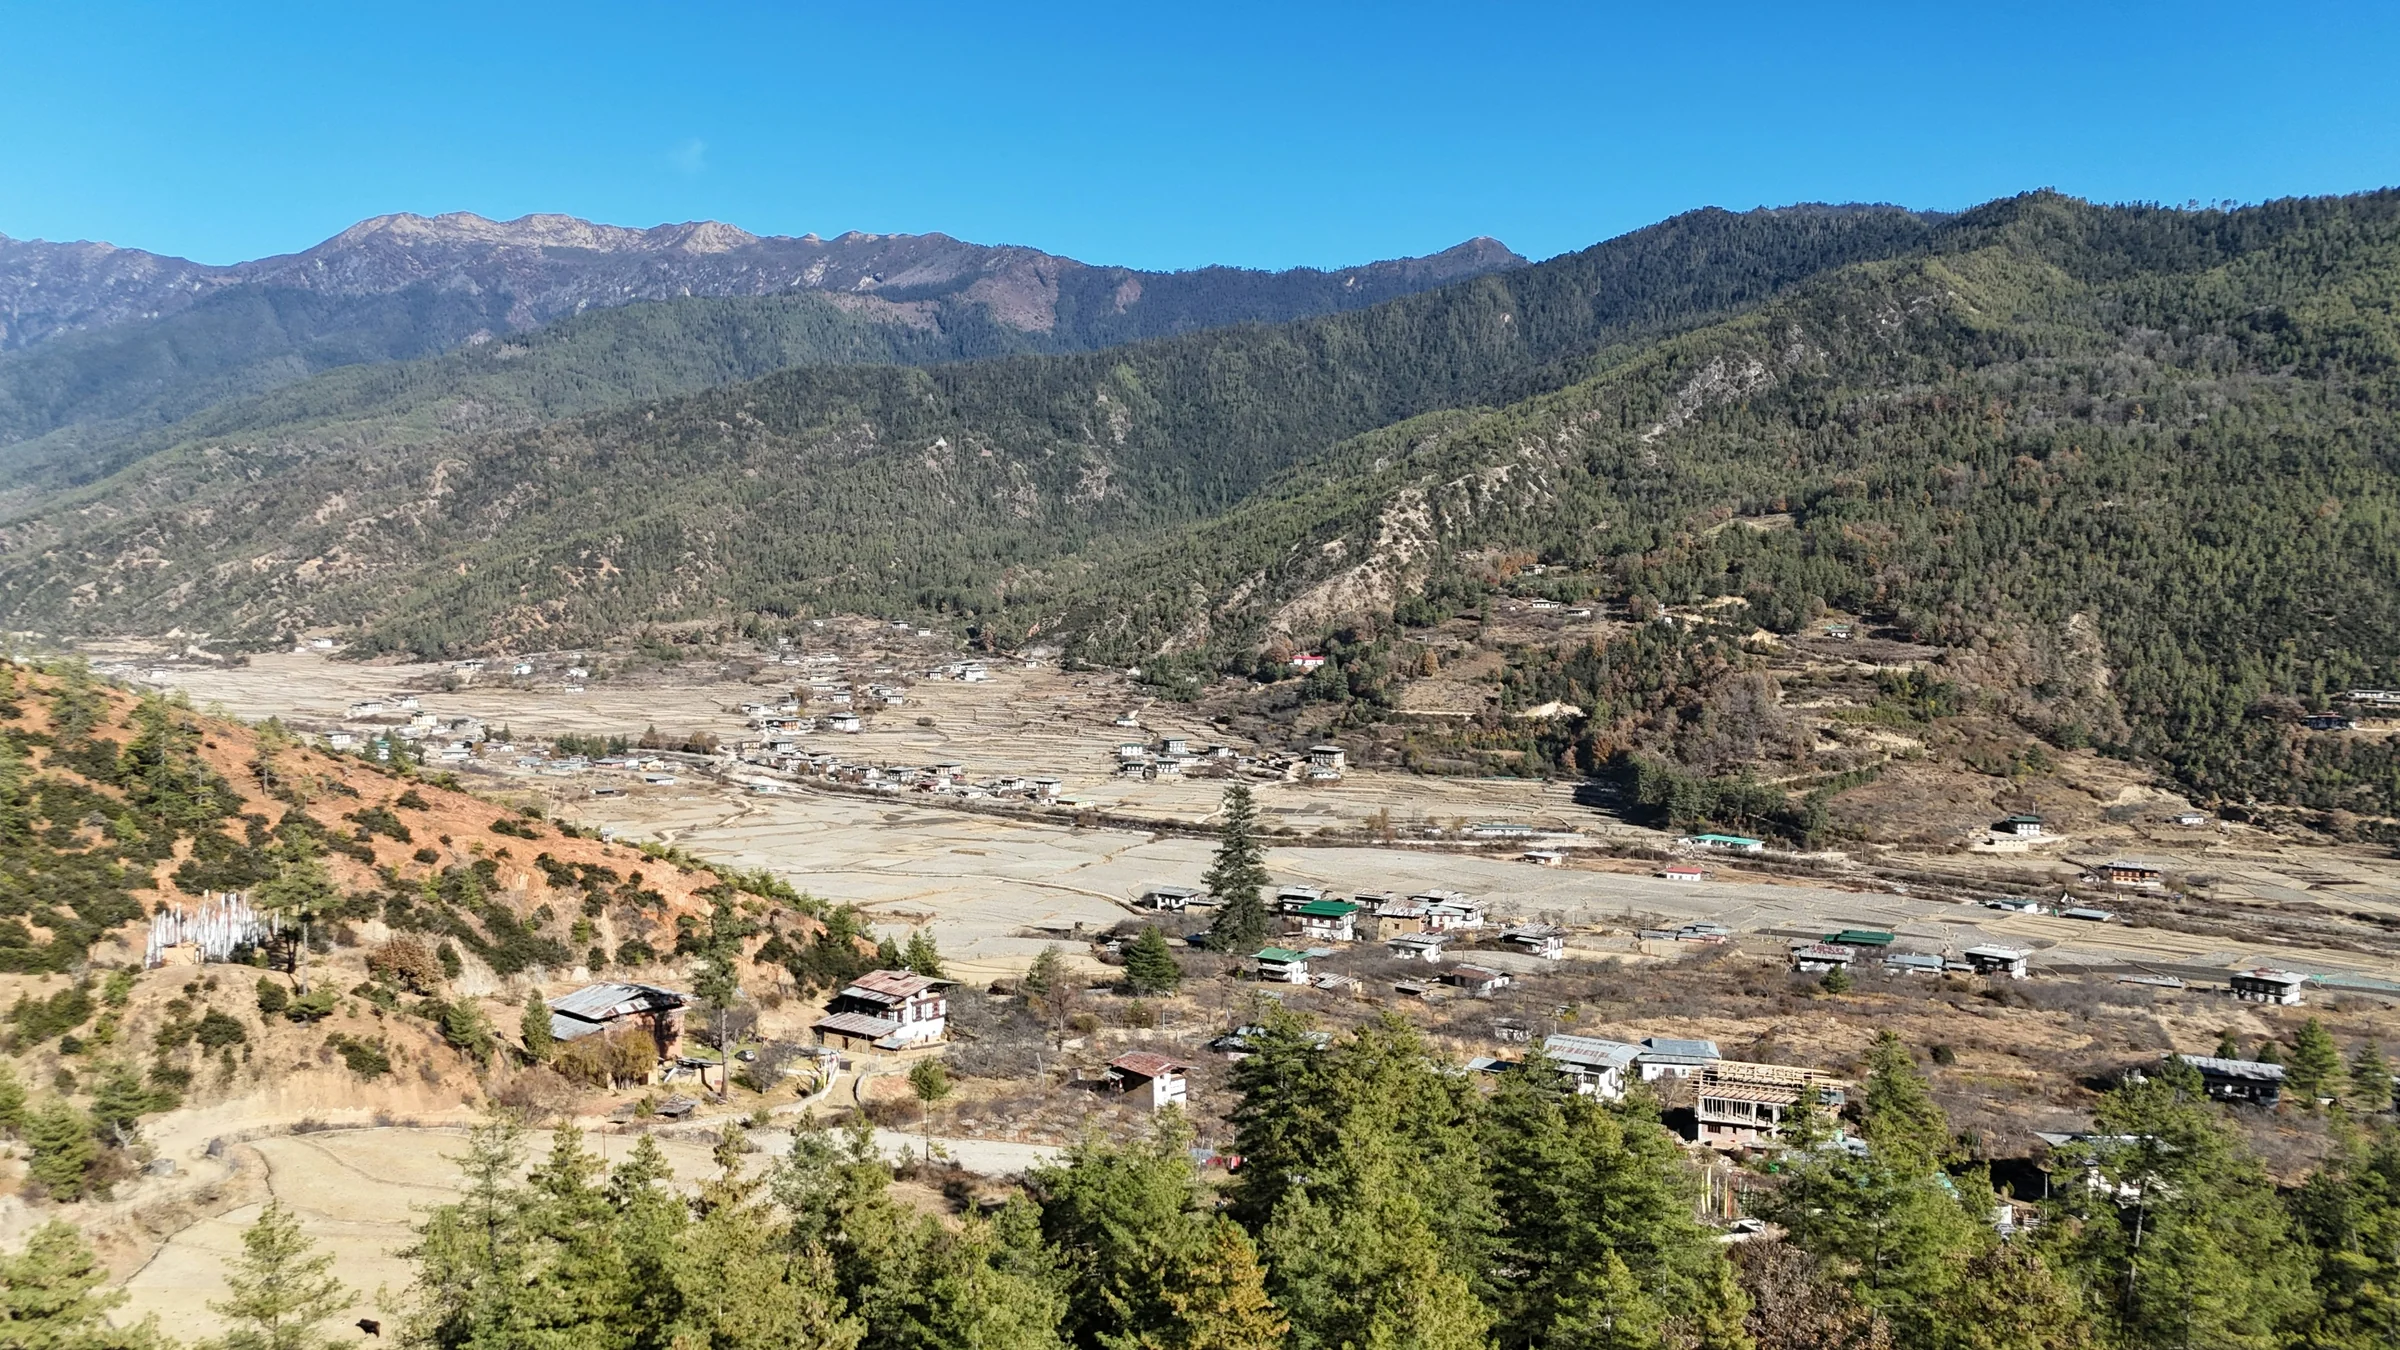
Bhutan (Paro Valley)
The only country whose tourism policy reads as a mindful-travel operating manual. The $200/night Sustainable Development Fee enforces longer stays and limits visitor count at the policy level — locals ratio (98) and stay length (95) are the highest in the index. Walkability scores lower (72) because the country is geographically dispersed, but the silence and unphotographed scores are near-ceiling. The structural, not stylistic, top of the index.
Faroe Islands
The runner-up by a thin margin, and the highest-scoring destination in the unphotographed dimension (96). The islands' weather and ferry geometry make them resistant to fast travel by design. Walkability is good in the small towns; silence is genuine; the ratio of sheep to humans is roughly two to one, and that fact tells you everything about the locals dimension.
Lofoten Islands
The Arctic Circle's most photogenic archipelago that has somehow stayed off the tourist-saturation map. High scores across all five dimensions; weakest at stay length (86) only because the typical visitor still tries to do the islands as a 4–5 day road trip when 7+ is the right number. The rorbu (fisherman's hut) accommodation tradition is structurally aligned with the ethic.
Setouchi (Naoshima / Teshima)
The Inland Sea is the only destination in the top 10 where the architecture itself enforces mindful travel — Tadao Ando's installations require slow, considered passage. Ferry schedules set the pace. Locals ratio is high (90) because the islands' depopulation crisis means residents still outnumber visitors most of the year. See the Aonagi dispatch for the long version.
Patagonia (Torres del Paine)
Highest silence score in the index (98). Walkability is low (60) for the obvious reason — this is a wilderness, not a town — and that drag is what keeps it out of the top three. Stay length is excellent (90) because the destination is structurally remote enough that fast travel isn't an option. The unphotographed score (92) reflects how much of the park stays off-camera even at peak season.
Hokkaido (Furano / Biei)
The agricultural prefecture of Japan, with the slow geometry of the Furano Plain. Locals ratio is a strong 90, walkability moderate, silence and unphotographed both in the high 80s. The structural advantage is that international travelers have heavily under-routed Hokkaido relative to Honshu, leaving the prefecture with Japanese-quality infrastructure and dramatically lower visitor density.
Kanazawa
The highest-walkability destination in the top 10 (90) — the only one in this tier that is also a city. The Kanazawa case is interesting: silence and unphotographed are not as high as the wilderness picks, but every other dimension scores so consistently that the composite holds. This is what mindful urbanism looks like. See the Kanazawa 48-hour dispatch.
Madeira (Funchal / Levadas)
The Atlantic island that has the levada walks — long irrigation channels doubling as some of the best easy hiking in Europe. Walkability is genuinely high (86), locals ratio strong (88), and the unphotographed dimension still in the low 80s despite Madeira's recent visibility lift. The risk vector is that this score will degrade fastest of any in the top 10 over the next 24 months.
Big Sur
The only U.S. destination in the top 10. Cell service is genuinely thin, which translates directly into high silence (90) and unphotographed (90) scores. Walkability is moderate (68); the destination is structurally a driving experience, but the slow rhythm of Highway 1 absorbs that drag. Length-of-stay is improving as remote work has rebuilt Big Sur as a multi-day stay rather than a day-trip from San Francisco.
Galápagos Islands
Wildlife forces presence: you cannot multitask an iguana. Stay length is high (86) because the boat-based and lodge-based itineraries are deliberately gentle in pace. Locals ratio is moderate (84) — the islands have a meaningful resident population, but visitor cap policy is what holds the score. Silence and unphotographed both in the mid-to-high 80s. The closer of the top 10 — and a reminder that "mindful" is structural, not subjective.
Methodology
Data sources
Silence scores draw on WHO ambient-noise data, published acoustic studies, and our own field notes during 2024–2026 site visits. Walkability uses Walk Score data where available, OSM pedestrian-network density elsewhere, and human verification at the city/town scale. Locals ratio uses national tourism-board annual visitor counts divided by the resident population of the destination's primary staying area, normalized. Stay length uses national tourism-board median-night data; where unavailable, OTA-derived booking data was used as a proxy. Unphotographed uses the inverse of the share of geotagged Instagram and TikTok content within a 3km radius of the destination's main staying area, indexed against the top 1,000 geotags for the broader region.
Formula
Each dimension is scaled to a 0–100 score relative to the full 50-destination set (not absolute). Composite score = silence + walkability + locals_ratio + stay_length + unphotographed, with each dimension weighted equally. Maximum theoretical score: 500. Highest observed: 455 (Bhutan).
Limitations and v1.0 caveats
This is version 1.0. Three honest limitations to flag.
1. Sample selection. The fifty destinations were chosen because they are ones travelers actually consider, not because they are the fifty most representative places on earth. There is a built-in bias toward established mindful-travel candidates and away from the literal long tail of the world.
2. Score precision. The 0–100 scores are accurate to roughly ±5 points. Differences smaller than that are noise; differences of 10 points or more are meaningful. The composite scores should be treated similarly — Bhutan and Faroe are functionally tied at the top, not separated by 7 meaningful points.
3. Temporal drift. Scores are a 2026 snapshot. Several destinations in the top 25 (Madeira, Hoi An, Lofoten) are visibly degrading on the locals ratio and unphotographed dimensions year-over-year. We will refresh annually.
License
The dataset is published under Creative Commons Attribution 4.0 (CC-BY-4.0). You may reproduce, modify, and redistribute the dataset and rankings for any purpose, including commercial, with attribution to "Trepic — The 2026 Mindful Travel Index" and a link back to https://trepic.co/index/2026-mindful-travel/.
What this index is for
Two audiences. First, travelers — anyone making a 2026 decision about where to spend the kind of time and money that a real trip costs. The index is meant to surface destinations that reward the trip you are trying to take, instead of the trip you keep being sold. The companion guides on mindful travel and slow travel walk through the practice.
Second, journalists, hoteliers, and creators looking for a data layer underneath the conversation. The dataset is open, the methodology is documented, and the scores are reproducible. Boutique hotels in any of the top 25 destinations are exactly the kind of properties Trepic partners with — see our Giraffe Manor dispatch and the Aman Resorts mindful-luxury essay for examples of how editorial pairs with ranked destinations.
If you publish using this index, please cite. If you find errors, write us — methodology v2.0 will incorporate verified corrections. The mindful travel glossary entry sits underneath all of this as the conceptual anchor, and the broader Trepic editorial archive is the long-form context.
About Trepic
Trepic is the creator economy meeting travel — AI-powered journaling that turns your itinerary into a story, and your story into a revenue stream. The platform pairs creator-written editorial dispatches with bookable boutique-hotel partners. Travelers read; creators earn up to 20% on the bookings they drive; hotels pay for honest, conversion-driven storytelling instead of impressions.
This index is part of Trepic Research — the data and methodology layer of our editorial work. We publish annually.